Nuts and Bolts of Chart Types
Published on 2024-09-15
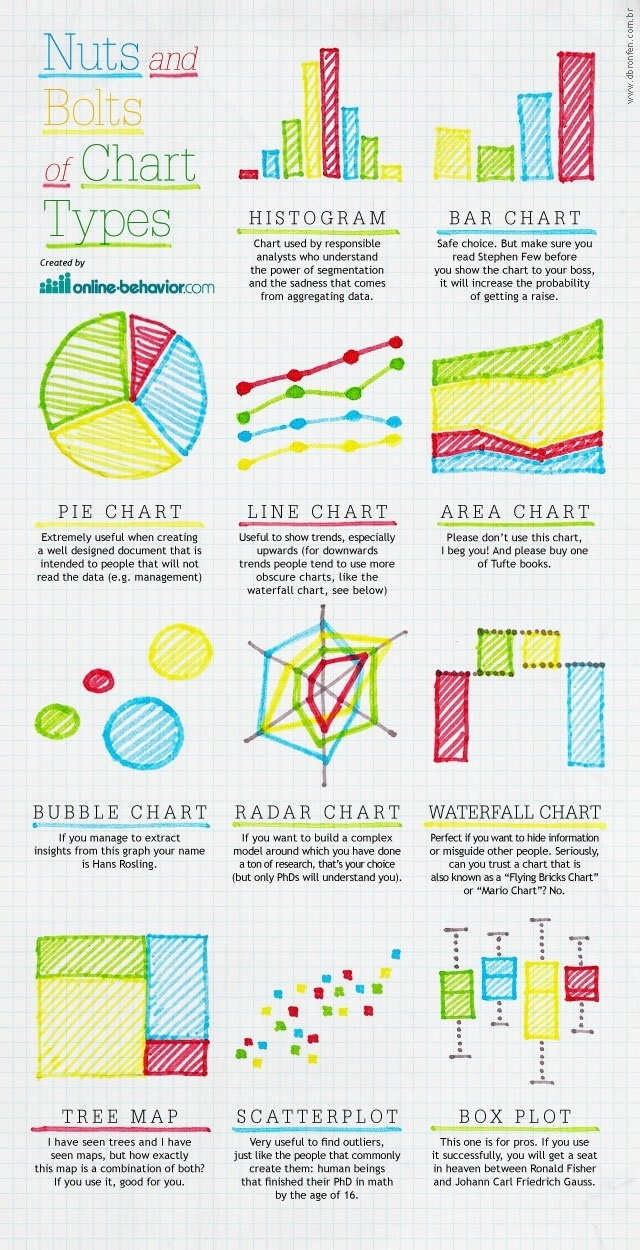
Could be Interesting! Data ScienceAs I was contemplating on how to best display the dashboard for stock analysis, I came across this Nuts and Bolts of Chart Types - I like its sarcastic tone, and to be fair, some of them have truth to it. I am going to leave it here for my future reference.
Nuts and Bolts of Chart Types, credit to online-behavior.com.
 .
.
For myself finance.boring-is-good.com, I decided to go with (1) Histogram, (2) Sentimental donuts and (3) the usual line+bar charts.
 AAPL stock price changes from 2024-01-01 to 2024-09-13
-
Histogram is helpful in determining the central tendency of stock price movement, as well as identifying the outliers. For my histogram, the bin width is the standard deviation of differences in price. It is a variation of Scott's Rule and using standard deviation alone is not a widely standard method for determining bin width in histograms. We can also use interquartile range (IQR), by substracting which measures the spread of data. For my data points, I want to keep it simple and just go with standard deviation for the bin width. The bin width indicates the extent of data dispersion, which reflects the fluctuations in stock price changes. Normalized value of the bin width should correlate with IV (implied volatility) of a stock.
After that, I use min, max, median and binWidth to build the bin edges. I know I can use the library to compute all of these, but I prefer computing it in my own way. Less obscure that way.const arr = data.value.map(item => item.diff); const len = arr.length; const meanValue = arr.reduce((acc, val) => acc + val, 0) / len; const variance = arr.reduce((acc, val) => acc + Math.pow(val - meanValue, 2), 0) / len; const binWidth = Math.ceil(Math.sqrt(variance)); -
Donut may not be the best representative, but, in this case, it helps me in understanding the sentimental of a stock. Instead of looking at it alone, this sentimental donut should be accompanied with other charts for a full picture.
-
Line is very useful in showing the trends whereas bar clearly illustrates the price movement. Look at the jump in 2024-04-14 to 2024-04-28. The reason? Apple announced its Apple Intelligence AI service. Apple was doing so poorly for the first half of the year, would you look at it now! Just 😱